
The headline influencer marketing statistics 2026 tell a consistent story: US creator ad spend is forecast at $44 billion this year, 87.49% of brands expect their influencer budgets to grow, and money is shifting toward smaller creators whose audiences look more authentic. Below are 40 data points, grouped by theme, each linked to its original source and written as of September 2026, so you can use them in a budget deck without second-guessing where they came from.
Key takeaways
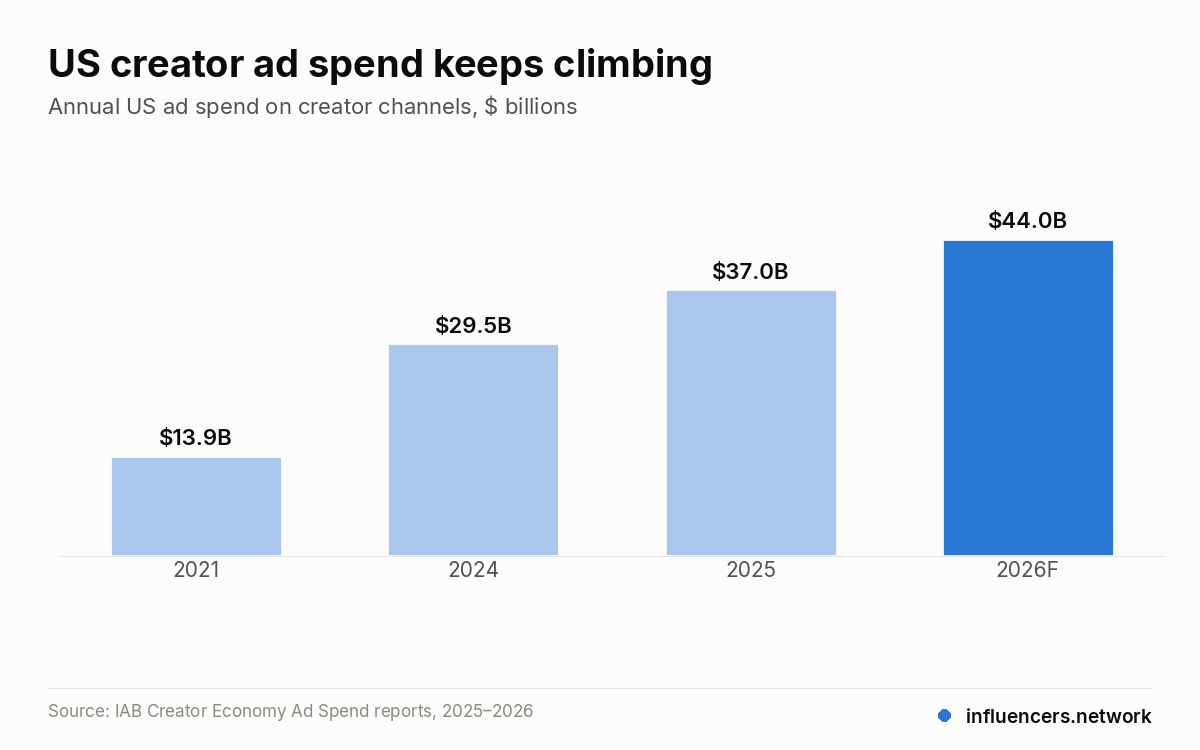
- US creator ad spend is projected at $44B in 2026, up from $13.9B in 2021 (IAB).
- 87.49% of brands expect bigger influencer budgets in 2026; 72.22% expect increases of 50% or more.
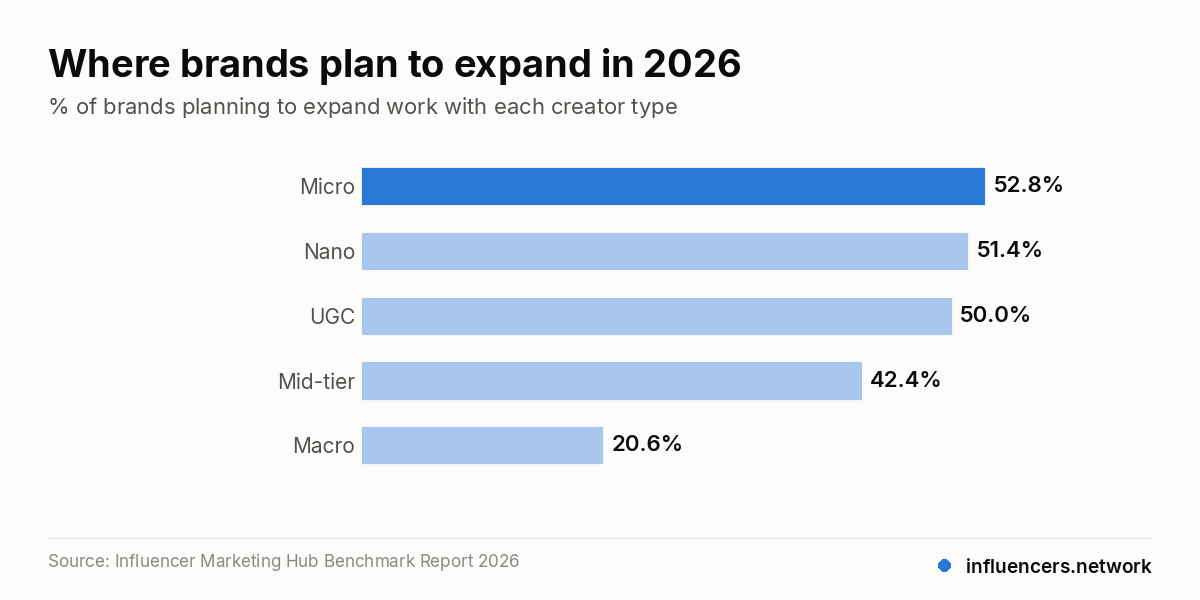
- Micro (52.83%) and nano (51.43%) creators top expansion plans, while only 20.59% plan to add macro creators.
- Fake followers are the top fraud concern (56.5%), and an audit of 100,000 accounts flagged 37.2% of followers as likely inauthentic.
- Pay is concentrated: the top 10% of creators received 62% of payments in 2025 (CreatorIQ).
Where these influencer marketing statistics come from
Most roundups recycle numbers without dates or methods. This one leans on a small set of primary sources and states what each actually measured:
- Influencer Marketing Hub Benchmark Report 2026: survey of 600+ brands, agencies and marketers.
- IAB Creator Economy Ad Spend & Strategy Report: US ad spend on creator channels.
- CreatorIQ State of Creator Compensation (January 2026): payment data from its platform.
- SociaVault Fake Follower Study 2026: audit of 100,000 Instagram and TikTok accounts.
- eMarketer and Goldman Sachs forecasts for the wider market context.
Keep one caveat in mind: “creator ad spend” (IAB) is a broader bucket than “influencer marketing spend” (eMarketer), because it also includes ads placed around creator content. The figures are not interchangeable, and we label each one accordingly.
Market size and growth (stats 1–10)
- US creator ad spend is projected to reach $44 billion in 2026, according to the IAB (August 2026).
- That is growing roughly 4x faster than the overall US media industry, per the IAB.
- US creator ad spend was $37 billion in 2025, up 26% from 2024.
- It was $29.5 billion in 2024, and $13.9 billion in 2021: more than double in three years.
- 48% of US ad buyers consider creators a “must buy” channel (IAB, 2025).
- The global creator marketing market was valued at $32.6 billion in 2025 (CreatorIQ; Influencer Marketing Hub cites $32.55B).
- Narrowly defined US influencer marketing spend passed $10.52 billion in 2025, per eMarketer.
- eMarketer expected that spend to grow 15.0% in 2025 and 15.7% in 2026.
- Goldman Sachs projected the creator economy could reach $480 billion by 2027, from $250 billion in 2023.
- Goldman estimated 50 million creators globally, with only about 4% earning over $100,000 a year.
The IAB explains its sizing method and the “must buy” finding in this short briefing from its official channel.
Budgets, payback and team structure (stats 11–19)
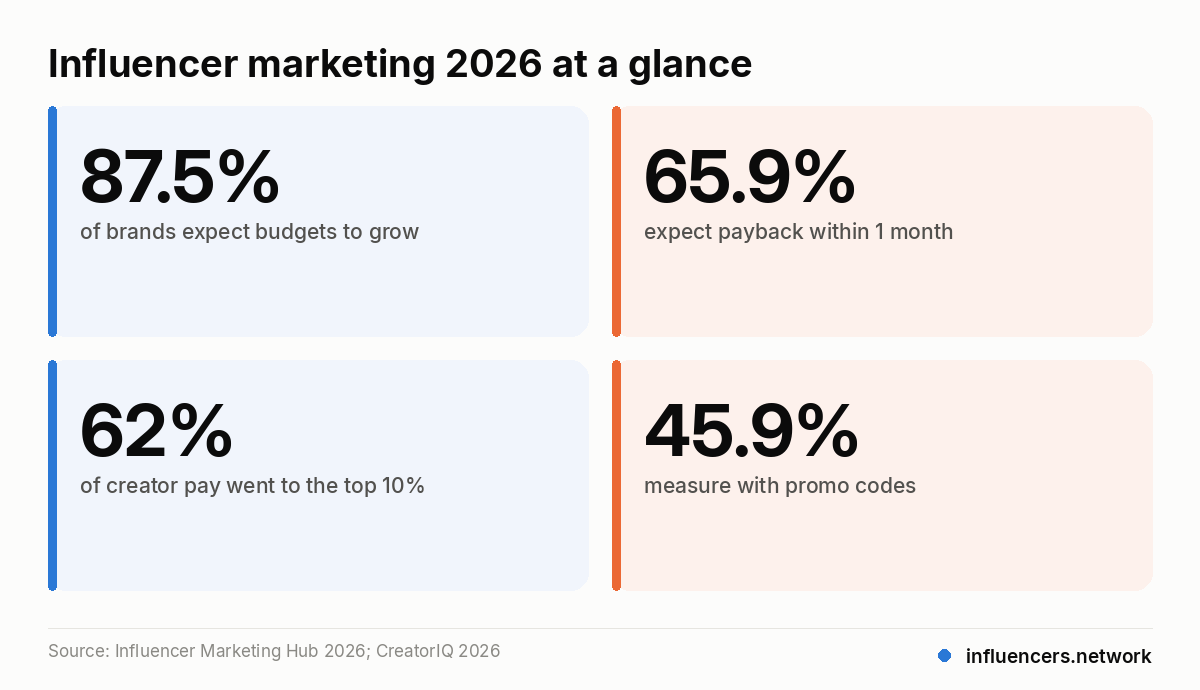
- 87.49% of brands expect their influencer budget to increase in 2026 (IMH).
- 72.22% expect an increase of 50% or more.
- Only 5.55% expect budgets to shrink.
- 65.9% expect a campaign to pay back within one month.
- 48.4% expect payback within two weeks.
- 66.3% run influencer marketing fully in-house.
- 10.71% use a hybrid model and another 10.71% rely fully on an agency.
- 12.24% of respondents do not run influencer marketing at all.
- Rising creator costs are the top challenge, cited by 35.4%.
Read stats 14 and 15 with care. Expecting payback in two weeks is realistic for promo-code driven ecommerce, but not for considered purchases or for regulated categories where registration, verification and deposit steps stretch the funnel. Set payback windows by product, not by industry averages.
Creator tiers and pricing (stats 20–27)
- 52.83% of brands plan to expand work with micro creators in 2026.
- 51.43% plan to expand with nano creators and 50% with UGC creators.
- 42.42% plan to expand with mid-tier creators, versus 20.59% for macro.
- About 55% of nano and micro deals are under $500, and about 80% of UGC deals are under $500 (IMH).
- The top 10% of creators received 62% of all creator payments in 2025, up from 53% in 2023 (CreatorIQ).
- The top 1% received 21% of payments, up from 15% in 2023.
- Average creator earnings per campaign were $11.4K; the median was $3K.
- Aggregate creator payments grew 59% year over year on CreatorIQ’s platform.
Typical per-post price ranges from Influencer Marketing Hub’s rate guide show why smaller tiers are attractive: you can test ten nano creators for the cost of one mid-tier post.
| Tier | TikTok | YouTube | |
|---|---|---|---|
| Nano | $100–500 | $200–1,000 | $500–1,500 |
| Micro | $500–5,000 | $1,000–5,000 | $1,000–5,000 |
| Mid-tier | $5,000+ | $5,000–10,000 | $5,000–10,000 |
| Macro | $5,000–10,000+ | $10,000+ | $10,000+ |
| Mega | $10,000+ | $10,000+ | $10,000+ |
Platforms, formats and AI (stats 28–33)
- 31% of brands include TikTok in their influencer plans, more than double Instagram; other networks cluster at 8–15% (IMH).
- Long-form video ranks in the top three most effective formats for 83%, short-form video for 80%.
- Live shopping ranks in the top three for 62%, while Stories (14%) and whitelisting (5%) trail far behind.
- 36.67% use AI mainly for creator discovery, the most common use case.
- 21.11% use AI for content generation and 13.89% for brief development.
- Only 10.56% are not using AI at all in their influencer programs.
The platform split is more concentrated than it looks. IMH describes it as a “single-platform bet”: most teams pick one primary network. eMarketer’s spend data points the other way at the dollar level, with Instagram and YouTube each attracting over $1 billion more US influencer spend than TikTok in 2025. Volume of programs and volume of dollars are different questions.
Measurement and social commerce (stats 34–36)
- Promo codes are the leading measurement method (45.9%), ahead of affiliate links (26.0%) and native shop features (25.0%).
- 53.33% of brands do not use social commerce yet; 46.67% plan to test it in 2026.
- Among social commerce adopters, 66.17% use TikTok Shop.
Promo codes are easy to launch but leak to coupon sites and undercount viewers who convert later on another device. If a campaign’s economics depend on accurate attribution, combine codes with tracked links and platform-side conversion data rather than relying on one signal.
Fraud and authenticity (stats 37–40)
- 56.5% of brands name fake or bot followers as their primary fraud concern, and 89.1% identify some fraud or quality risk (IMH).
- SociaVault flagged 37.2% of followers across 100,000 accounts as showing signs of being fake or inauthentic: 41.8% on Instagram and 32.6% on TikTok.
- Suspected fake followers rise with size: 27.6% for nano accounts up to 48.3% for macro (100K–500K).
- SociaVault estimates about $4.6 billion a year in brand spend is wasted on compromised partnerships; comment-quality analysis was its most accurate detection signal (87.3%).
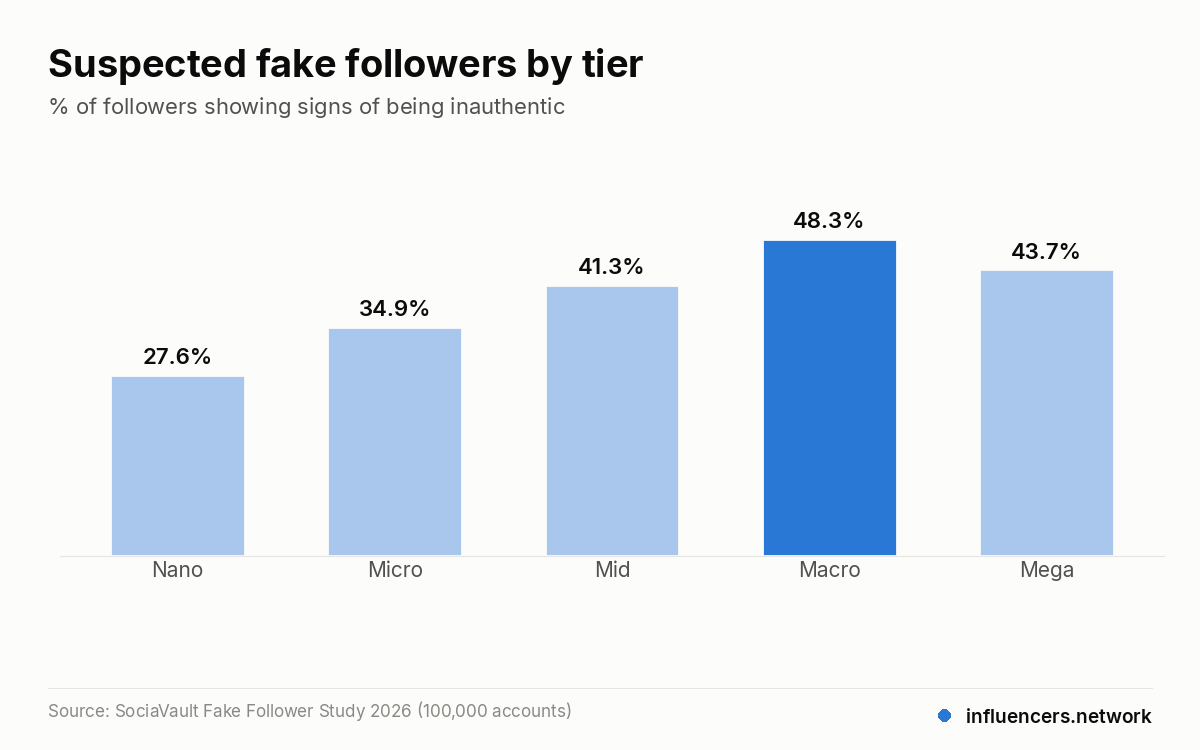
Among all the influencer marketing statistics 2026 has produced, stat 39 is a big part of why brands are moving down-tier. Paying for reach only makes sense if the reach is real, which is why follower counts alone are a weak basis for any rate negotiation.
What the numbers mean for iGaming brands
General benchmarks transfer to casino, betting and esports only partially. Three differences matter:
- Live streaming, not feeds, drives the category. Slots & Casino on Kick averaged 147,438 viewers in September 2026 to date, per Streams Charts. Our gambling streaming statistics cover that side in depth.
- The market is moving online. H2 Gambling Capital puts online at 41% of global gambling GGR in 2024 ($293bn of $712bn), rising to about 51% by 2030.
- Rules restrict who can promote. Ontario, the UK and Spain all limit influencers with appeal to minors, and Brazil’s Senate is weighing a sweeping ad ban. Compliance checks belong in creator selection, not after the contract is signed.
The practical takeaway: apply the same discipline the wider market is adopting, meaning smaller creators, verified audiences and tracked conversions, but screen every creator for licensing, audience age and geography first. The influencer marketing guide walks through that process step by step.
How to use influencer marketing statistics 2026 in your plan
- Size the test budget by tier. With most nano and micro deals under $500, a 10–20 creator pilot is affordable and gives you comparison data.
- Audit before you pay. Check comment quality, audience geography and follower growth spikes; the fraud data says this pays for itself.
- Match KPIs to funnel stage. Brands growing budgets 50%+ still weight awareness (89%) far above attributable revenue (25%).
- Track with more than one method. Codes plus links plus post-campaign lift checks beat any single signal.
- Budget for rising rates. If 35.4% already see creator costs as their top challenge, lock in multi-month agreements with proven performers.
18+ | Play responsibly. Gambling involves risk and should never be seen as a way to make money. Only work with operators licensed in the viewer’s jurisdiction. Help: BeGambleAware, NCPG (1-800-GAMBLER), JugarBien.
Frequently asked questions
What are the most important influencer marketing statistics 2026 brands should know?
Start with four: US creator ad spend is forecast at $44 billion, 87.49% of brands expect budget growth, micro and nano creators lead expansion plans, and 37.2% of audited followers look inauthentic.
How big is the influencer marketing industry in 2026?
The IAB projects US creator ad spend at $44 billion in 2026. Globally, CreatorIQ and Influencer Marketing Hub valued creator and influencer marketing at about $32.6 billion in 2025. The figures use different definitions, so compare like with like.
Are influencer marketing budgets still growing?
Yes. In Influencer Marketing Hub’s 2026 benchmark, 87.49% of respondents expect budgets to increase and only 5.55% expect a decrease.
Which influencer tier are brands investing in most?
Micro (52.83%) and nano (51.43%) creators lead expansion plans, followed by UGC creators (50%). Only 20.59% plan to expand macro partnerships.
How common are fake followers?
SociaVault’s 2026 audit of 100,000 accounts found 37.2% of followers showed signs of being fake or inauthentic, higher on Instagram (41.8%) than TikTok (32.6%), and highest among macro accounts (48.3%).
How do brands measure influencer campaigns?
Promo codes are most common (45.9%), followed by affiliate links (26.0%) and native shop features (25.0%), according to Influencer Marketing Hub.
Ready to turn these benchmarks into a shortlist? Explore vetted casino, betting and esports creators in the influencers.network database or compare plans for brands.
Comentarios
[…] fees are also where general influencer pricing benchmarks help. Our influencer marketing statistics for 2026 show that rising creator costs are the top challenge for 35.4% of brands, which explains why […]